Contents
- 実行環境、主な流れ
- PostGIS
による SVG 出力 - JavaScript
による SVG 操作
実行環境、主な流れ
実行環境はデータを見るクライアントはブラウザ。配置やスタイルの変更が、HTML(か
PostGIS
下が、昨日取り込んだ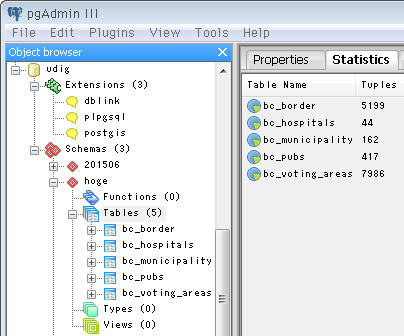
COPY (
    SELECT text '<?xml version="1.0" encoding="UTF-8" ?>' ||
        '<svg xmlns="http://www.w3.org/2000/svg">'

    UNION ALL
    SELECT '<g id="border">' || string_agg('<path d="' ||
        ST_AsSVG(ST_Transform(the_geom, 3005),
            maxdecimaldigits := 0) || '"/>', '') || '</g>'
    FROM hoge.bc_border

    UNION ALL
    SELECT '<g id="hospitals">' || string_agg('<ellipse ' ||
        ST_AsSVG(the_geom,
            maxdecimaldigits := 0) || '/>', '') || '</g>'
    FROM hoge.bc_hospitals

    UNION ALL
    SELECT '<g id="municipality">' || string_agg('<path d="' ||
        ST_AsSVG(the_geom,
            maxdecimaldigits := 0) || '"/>', '') || '</g>'
    FROM hoge.bc_municipality

    UNION ALL
    SELECT '<g id="pubs">' || string_agg('<ellipse ' ||
        ST_AsSVG(the_geom,
            maxdecimaldigits := 0) || '/>', '') || '</g>'
    FROM hoge.bc_pubs

    UNION ALL
    SELECT '<g id="voting_areas">' || string_agg('<path d="' ||
        ST_AsSVG(the_geom,
            maxdecimaldigits := 0) || '"/>', '') || '</g>'
    FROM hoge.bc_voting_areas

    UNION ALL
    SELECT '</svg>'
) TO 'R:/test.svg';
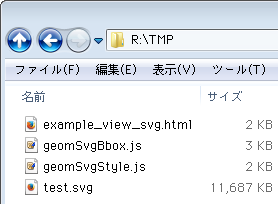
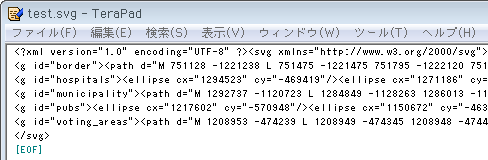
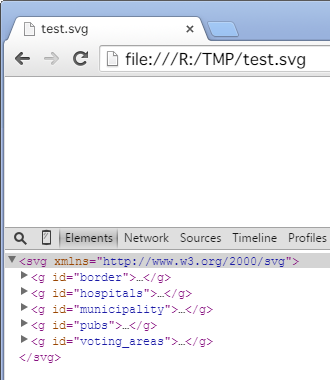
テーブル
↓ 出力された
JavaScript
今回、二つのクラス/* coding: utf-8 */
var SvgBbox = function (svg) {
this.svg = svg;
this.width = document.body.clientWidth;
this.height = null;
this.fringe = 0;
this.scale1px = null;
this.vaspOption = 1;
};
SvgBbox.prototype.calc = function (id) {
var chd = this.svg.getElementById(id).childNodes,
aryX = Array(),
aryY = Array();
for (var i = 0, len = chd.length; i < len; i++) {
var ele = chd[i],
tgn = ele.tagName;
if (tgn === 'ellipse') {
aryX.push(Number(ele.getAttribute('cx')));
aryY.push(Number(ele.getAttribute('cy')));
} else if (tgn === 'text') {
aryX.push(Number(ele.getAttribute('x')));
aryY.push(Number(ele.getAttribute('y')));
} else if (tgn === 'path') {
var seg = ele.pathSegList;
for (var j = 0, len2 = seg.length; j < len2; j++) {
var s = seg[j];
if (s.pathSegType === 2 || s.pathSegType === 4) {
// only SVGPathSegMovetoAbs or SVGPathSegLinetoAbs
aryX.push(s.x);
aryY.push(s.y);
}
}
}
}
var x1 = Math.min.apply(null, aryX),
y1 = Math.min.apply(null, aryY),
x2 = Math.max.apply(null, aryX),
y2 = Math.max.apply(null, aryY),
hh = y2 - y1,
ww = x2 - x1;
this.scale1px = ww / this.width;
this.height = hh / this.scale1px;
var fgx = this.fringe * this.scale1px,
fgy = this.fringe * this.scale1px / this.vaspOption;
fg2x = this.fringe * 2,
fg2y = this.fringe * 2 / this.vaspOption;
this.svg.setAttribute('preserveAspectRatio', 'none');
this.svg.setAttribute('height', this.height * this.vaspOption + fg2y);
this.svg.setAttribute('width', this.width + fg2x);
this.svg.setAttribute('viewBox', Array(
x1 - fgx, y1 - fgy, x2 - x1 + fgx * 2, y2 - y1 + fgy * 2).join(' '));
};
/* coding: utf-8 */

var SvgStyle = function (svg, bbox) {
    this.svg = svg;
    this.bb = bbox;
};

SvgStyle.prototype.setTop = function (id) {
    var g = this.svg.getElementById(id),
        p = g.parentNode;
    p.removeChild(g);
    p.appendChild(g);
};

SvgStyle.prototype.setStrokeWidth = function (id, num) {
    var g = this.svg.getElementById(id),
        chd = g.childNodes,
        len = chd.length;
    for (var i = 0; i < len; i++) {
        chd[i].setAttribute('vector-effect', 'non-scaling-stroke');
    }
    g.setAttribute('stroke-width', num);
};

SvgStyle.prototype.setRadius = function (id, num, originalScale) {
    var els = this.svg.getElementById(id).getElementsByTagName('ellipse'),
        len = els.length,
        rx = num,
        ry = num / this.bb.vaspOption;
    if (! originalScale) {
        rx *= this.bb.scale1px;
        ry *= this.bb.scale1px;
    }
    for (var i = 0; i < len; i++) {
        var e = els[i];
        e.setAttribute('rx', rx);
        e.setAttribute('ry', ry);
    }
};

SvgStyle.prototype.css = function (text) {
    var ss = this.svg.parentNode.styleSheets;
    if (ss.length === 0) {
        this.svg.appendChild(document.createElementNS(
            'http://www.w3.org/2000/svg', 'style'));
    }
    ss[0].insertRule(text, 0);
};
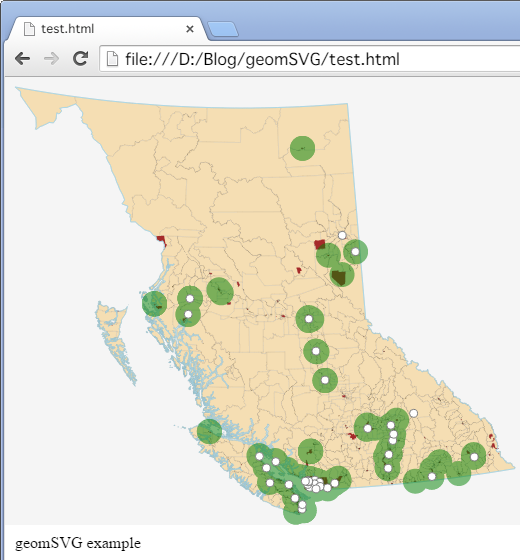
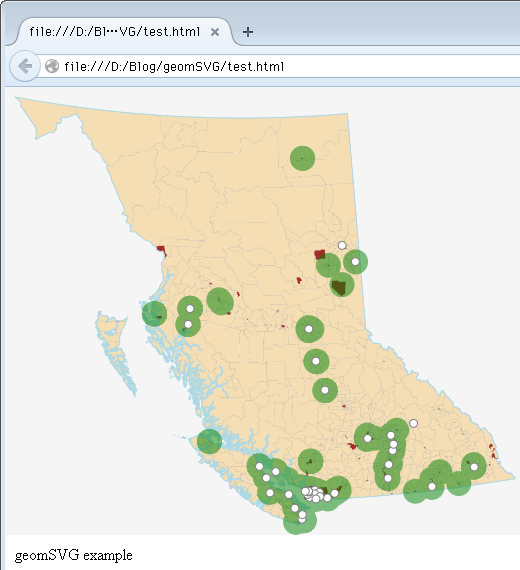
最後に ↓ 表示用の
<!DOCTYPE html><html>
<head>
<meta charset="UTF-8">
<style><!--
    body {
        margin: 0;
    }
    object {
        background: whitesmoke;
    }
    div.caption {
        margin: 5px 10px;
    }
--></style>
</head>
<body>

<object data="test.svg"></object>
<div class="caption">geomSVG example</div>

<script src="geomSvgBbox.js"></script>
<script src="geomSvgStyle.js"></script>
<script><!--
window.addEventListener('load', function () {
    var obj = document.getElementsByTagName('object')[0],
        svg = obj.contentDocument.documentElement,
        b = new SvgBbox(svg),
        s = new SvgStyle(svg, b);

    b.width = 500; // 表示横幅. 無指定ならブラウザ横幅
    b.fringe = 10; // 周縁ピクセル数. 無指定ならゼロ
    // b.vaspOption = 1.3; // 横に対する縦の補正比率
    b.calc('border');

    s.setTop('municipality');
    s.setTop('border');
    s.setTop('pubs');
    s.setTop('hospitals');
    s.setStrokeWidth('hospitals', 1);
    s.setStrokeWidth('border', 1);
    s.setStrokeWidth('voting_areas', 0.1);
    s.setRadius('hospitals', 4);
    s.setRadius('pubs', 40000, true); // 第3引数 真なら座標値で指定

    s.css('#border { fill: none; stroke: lightblue }');
    s.css('#hospitals { fill: white; stroke: gray }');
    s.css('#municipality { fill: brown }');
    s.css('#pubs { fill: green; opacity: 0.5 }');
    s.css('#voting_areas { fill: wheat; stroke: gray }');
});
//--></script>
</body>
</html>
以上まとめると ↓