psqlの外部コマンド実行を使い、CUIでグラフを描けるアプリとなるべく簡単に連携する(PostgreSQLのデータをプロットする)いくつかの方法のメモです。予定としてはgnuplot、Octave、R、Scilab。今日はgnuplotですが、自分のCygwinではdumbターミナルしか起動しないので、とても地味な画面になりました。
※ 追記 #1(8月6日)、#2(8月7日、実行ユーザの件)
実行環境
• Windows7 x64 + Cygwin 2.5.1 + ConEmu 150813g
• Cygwin版psql(パッケージpostgresql-client 9.5.3でインストール)
• Cygwin版gnuplot 5.0.0(同じくパッケージでインストール)
• Windowsの管理者権限ユーザ
今回、psqlはCygwin版のみ使います。Windowsネイティブだと、外部コマンド実行のベースがCMD.EXEになって制約が多いため。
バッチモード(グラフ出力後、psqlに戻る)
gnuplotのインタラクティブシェルに入らず、コマンドを実行してすぐ戻るモード。この場合、psqlのメタコマンド\gから標準出力でデータを渡せます。ファイル出力が不要で手軽。クエリを変えながら1回ずつグラフ化して見る場合などに。
基本の流れは ↓ こんな感じ。最初に出力内容を「データのみ、整形なし、タブ区切り」にしてgnuplotで読めるよう設定。次に任意のクエリを書き、\gコマンドからパイプでgnuplotに渡します。
(追記 8月6日)plot '<cat' の代わりに plot '-' も使えました。実例は次回のここ。
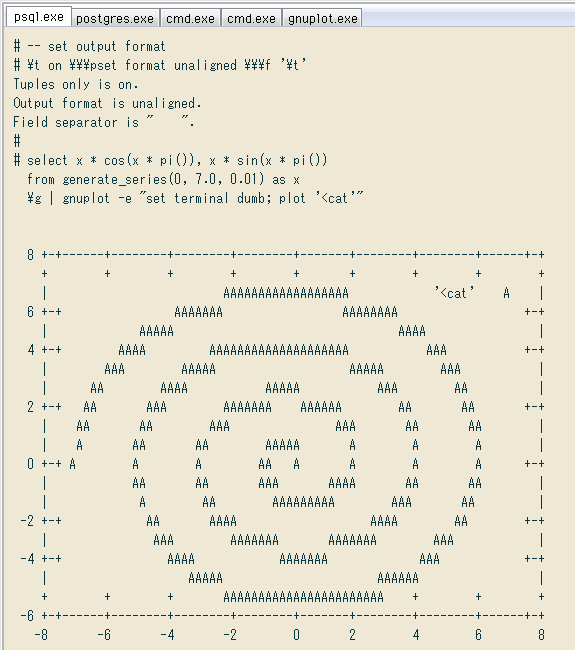
-- set output format
# \t on \\\pset format unaligned \\\f '\t'

# select x * cos(x * pi()), x * sin(x * pi())
  from generate_series(0, 7.0, 0.01) as x
  \g | gnuplot -e "set terminal dumb; plot '<cat'"
 gnuplotの起動オプション-eで実行コマンドを指定。出力デバイスやグラフスタイルなど自由に設定できます。が自分の環境では、ファイル出力以外のデバイスがdumbしか使えず。関連ライブラリを追加すればいいかもしれないけど。
一つのポイントは、plotの引数に「catコマンドからのリダイレクト」を書くことで標準入力を受け取るところ。下記で知りました。
pipe plot data to gnuplot script - Stack Overflow
クエリ結果を確認してからグラフ描画したければ ↓ セミコロンと改行でSQLだけ先に実行し、続いて\g以下だけ打てばOK。
gnuplotの起動オプション-eで実行コマンドを指定。出力デバイスやグラフスタイルなど自由に設定できます。が自分の環境では、ファイル出力以外のデバイスがdumbしか使えず。関連ライブラリを追加すればいいかもしれないけど。
一つのポイントは、plotの引数に「catコマンドからのリダイレクト」を書くことで標準入力を受け取るところ。下記で知りました。
pipe plot data to gnuplot script - Stack Overflow
クエリ結果を確認してからグラフ描画したければ ↓ セミコロンと改行でSQLだけ先に実行し、続いて\g以下だけ打てばOK。
# select ... ;  -- execute SQL
...
... (query result)
...
# \g | gnuplot ... (same as above)
メタコマンド\g以下が長いので ↓ こんな風にpsqlの変数として定義すると便利。一重引用符の中にコマンドを書き、\や'はエスケープのため2つ連続させます。変数名は何でもよく、実行は「:変数名」で。
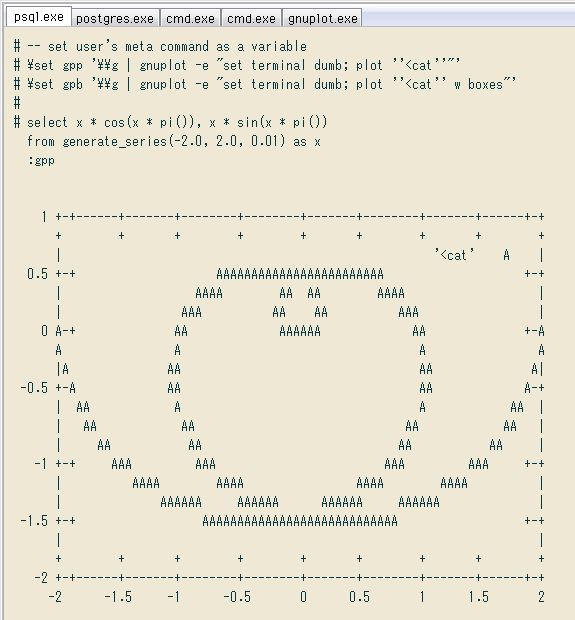
-- set user's meta command as a variable
# \set gpp '\\g | gnuplot -e "set terminal dumb; plot ''<cat''"'
# \set gpb '\\g | gnuplot -e "set terminal dumb; plot ''<cat'' w boxes"'
-- set output format
# \t on \\\pset format unaligned \\\f '\t'
# select x * cos(x * pi()), x * sin(x * pi())
from generate_series(-2.0, 2.0, 0.01) as x
:gpp
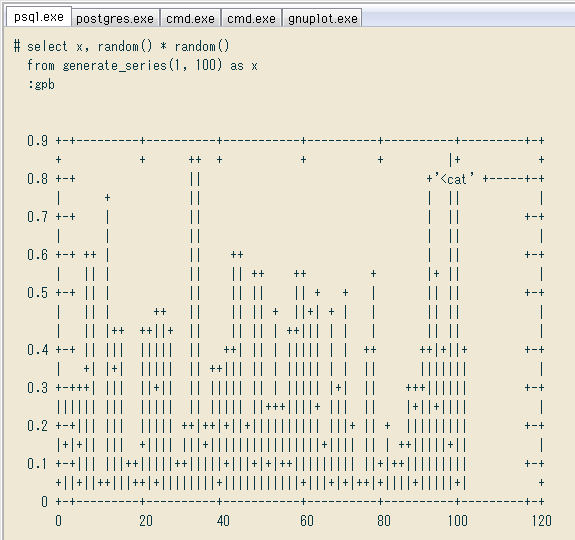
# select x, random() * random()
from generate_series(1, 100) as x
:gpb
 定義した変数名・内容の確認は ↓ メタコマンド\setで。なお定義時にエスケープで2重にした\\や''は、1つで表示されます。
# \set
...
gpp = '\g | gnuplot -e "set terminal dumb; plot '<cat'"'
gpb = '\g | gnuplot -e "set terminal dumb; plot '<cat' w boxes"'
対話モード(gnuplotのシェルに入り、作業後にpsqlに戻る)
今回のdumbデバイスでは意味薄いですが、グラフを調整したい時はこちらが便利。ただし標準入力を渡せないので(そうすると自動的にバッチモードになる)一時ファイルを経由せざるを得ません。
例えば ↓ 「\g ファイルパス」で出力、続いて外部コマンドとしてgnuplotを実行。オプション-eは前処理です(ファイルパスを変数に格納)。ポイントはオプション最後にハイフンを付けること。これでgnuplotのインタラクティブシェルに留まり、好きなタイミングでexitしてpsqlに戻れます。一時ファイルの後始末を忘れずに。
-- set output format
# \t on \\\pset format unaligned \\\f '\t'

# select x, random() * random()
  from generate_series(1, 100) as x
# \g tmp.dat \\\! gnuplot -e "d='tmp.dat'; set terminal dumb;" -

gnuplot> p d w boxes  (= plot d with boxes)
gnuplot> p d using 1 w boxes
gnuplot> ...
gnuplot> ... (plot as you want)
gnuplot> exit
# \! rm tmp.dat
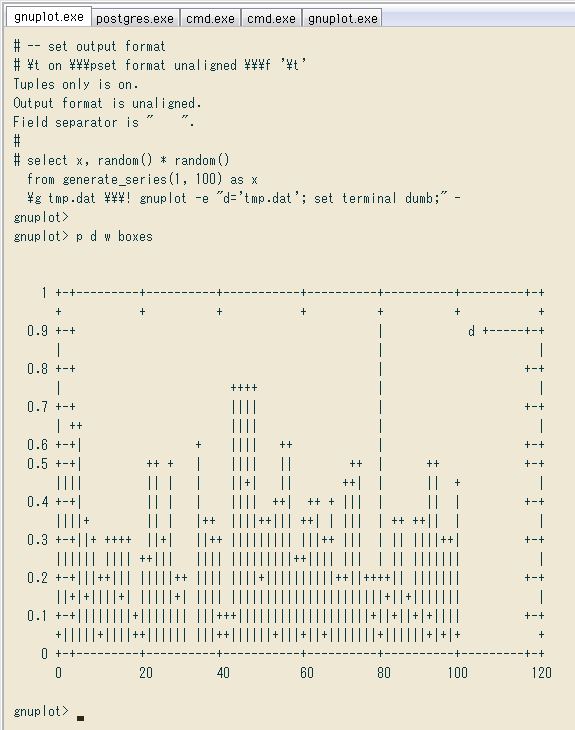
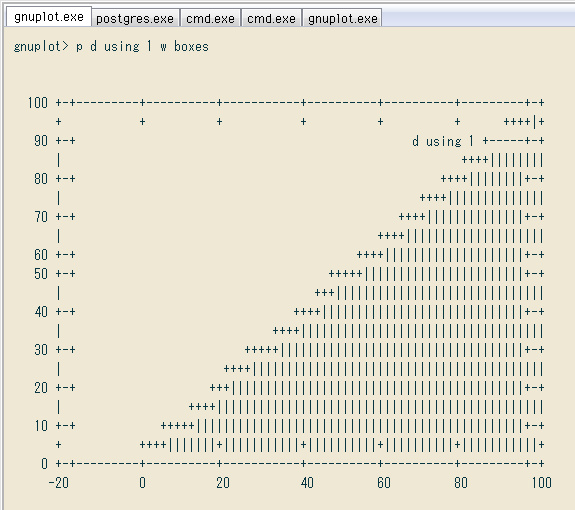 上のようにusing 列番号でプロット対象を変更可。グラフにしたいデータをまとめて渡し、gnuplot側で対象を切り替えて比較する時に便利です。
当初、gnuplotの起動オプション--persistが対話シェルに留まるものかと勘違い(確かOctaveがそうだった)。実際はコンソール外に起動したグラフィックウィンドウをそのまま残すものでした。だから ↓ ここでは意味がなく、シェルに留まるには末尾のハイフンが必須です。
上のようにusing 列番号でプロット対象を変更可。グラフにしたいデータをまとめて渡し、gnuplot側で対象を切り替えて比較する時に便利です。
当初、gnuplotの起動オプション--persistが対話シェルに留まるものかと勘違い(確かOctaveがそうだった)。実際はコンソール外に起動したグラフィックウィンドウをそのまま残すものでした。だから ↓ ここでは意味がなく、シェルに留まるには末尾のハイフンが必須です。
# select x, sum(random()) over(order by x) / x
  from generate_series(1, 1000) as x
# \g tmp.dat \\\! gnuplot -e "d='tmp.dat'; set terminal dumb" --persist
#
# \g tmp.dat \\\! gnuplot -e "d='tmp.dat'; set terminal dumb" -
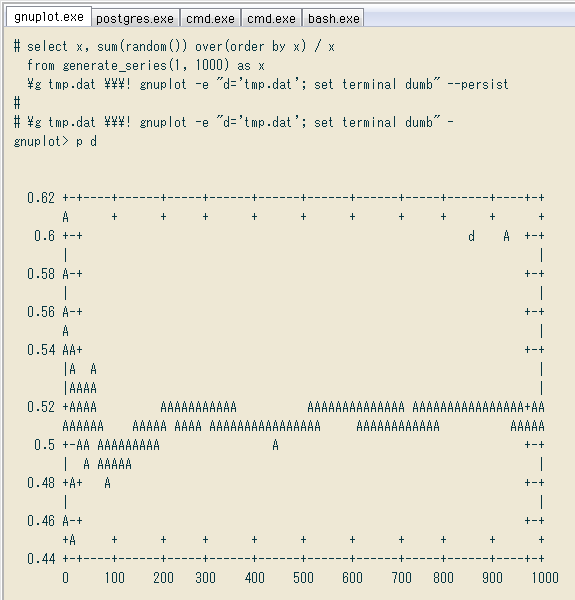 さすがにdumbだけでは見映えが残念。次はgnuplotをWindows版に変更し、コンソールからグラフィックウィンドウを起動します。psqlがCygwin上で動いてるので、パスや引数の扱いが面倒かも。