前回はCygwin版gnuplotのdumbターミナルを使い、コンソールに疑似的なグラフ(いわゆるASCII PLOT)を出しました。今日は普通のグラフィックウィンドウにグラフを表示。前回を含めたpsql→gnuplotのまとめも最後にあります。
実行環境
• Windows7 x64 + Cygwin 2.5.1 + ConEmu 150813g
• Cygwin版psql(パッケージpostgresql-client 9.5.3でインストール)
• Windows版gnuplot 5.0.4
• Windowsの管理者権限ユーザ
psqlが接続したPostgreSQLはWindows版の9.5.3(直接関係ないけど。何らかDBサーバに接続しないとpsqlを使えないので)。gnuplotは、SourceForgeのプロジェクトページからgp504-win64-mingw.zipをダウンロード&適当な場所に解凍。これでポータブルに使えます。
準備その1 : CygwinのbashシェルからWin版gnuplot起動
今日の大枠は「Cygwin版psqlから外部コマンドとしてWin版gnuplotを実行」。前提としてpsqlが走ってるシェル(Cygwin上のbash)からWin版gnuplotを起動できることがあるので、その確認からします。
いろんなパス記述法がある中、↓ のように「ドライブレター始まりのスラッシュ区切りのフルパス」でOKでした。当初はcygdriveを含めたりcygpathを使ったり必要かな~と思ってたところ、意外に簡単。
$ d:/works/gnuplot/current/bin/gnuplot

        G N U P L O T
        Version 5.0 patchlevel 4    last modified 2016-07-21

        Copyright (C) 1986-1993, 1998, 2004, 2007-2016
        Thomas Williams, Colin Kelley and many others

        gnuplot home:     http://www.gnuplot.info
        faq, bugs, etc:   type "help FAQ"
        immediate help:   type "help"  (plot window: hit 'h')

gnuplot changed the codepage of this console from 65001 to 932 to
match the graph window. Some characters might only display correctly
if you change the font to a non-raster type.

Terminal type set to 'wxt'
gnuplot>
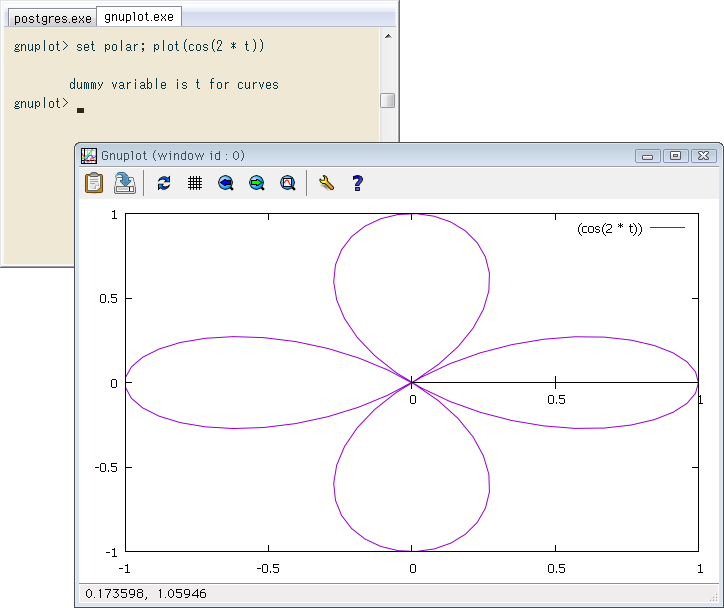
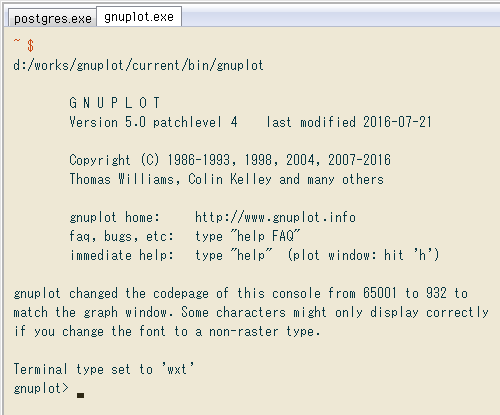 起動メッセージの最後にTerminal type set to 'wxt'、つまりwxWidgetsがデフォルトのグラフィックデバイスとして使えます。これでコンソール外に普通のグラフを、例えば ↓ のように出せます。
gnuplot> set polar; plot(cos(2 * t))
        dummy variable is t for curves
(graphic window appears)
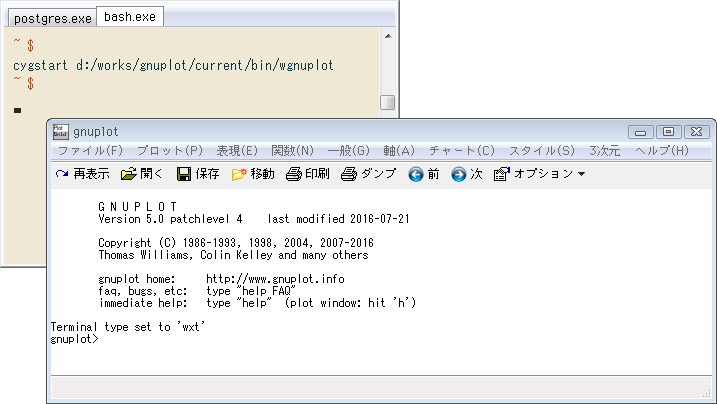
 Win版にはwgnuplot.exeという、GUIメニュー付の独自コンソールもあり。↓ のようにcygstartで起動するとwgnuplotを閉じずにシェルに戻り、並行作業ができます。
$ cygstart d:/works/gnuplot/current/bin/wgnuplot
(gnuplot GUI window starts)
$
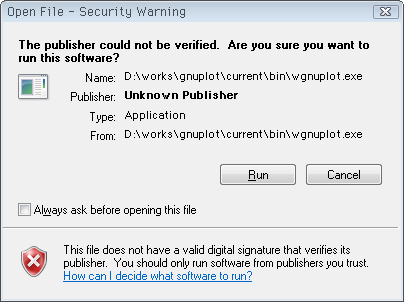
 cygstartでの起動に当たりセキュリティの警告が出たので ↓ 次から出ないようにチェックを外しました。
 なおWin版gnuplotの場所にパスを通して起動を簡単にする方法もありますが、Cygwin版もインストールしているのでどっちが優先的に起動するか分からず、やめました。
準備その2 : Cygwin版psqlからWin版gnuplot起動
psqlから、外部プログラム実行のメタコマンド\!でgnuplotを起動できるか確認。その前にパスを適当な環境変数に入れて記述しやすくしました。先ほどと同じ起動メッセージが出て、グラフ表示も問題なし。これで準備終わりです。
-- set gnuplot path
# \setenv wingp 'd:/works/gnuplot/current/bin'
# \! $wingp/gnuplot
G N U P L O T
Version 5.0 patchlevel 4 last modified 2016-07-21
...
Terminal type set to 'wxt'
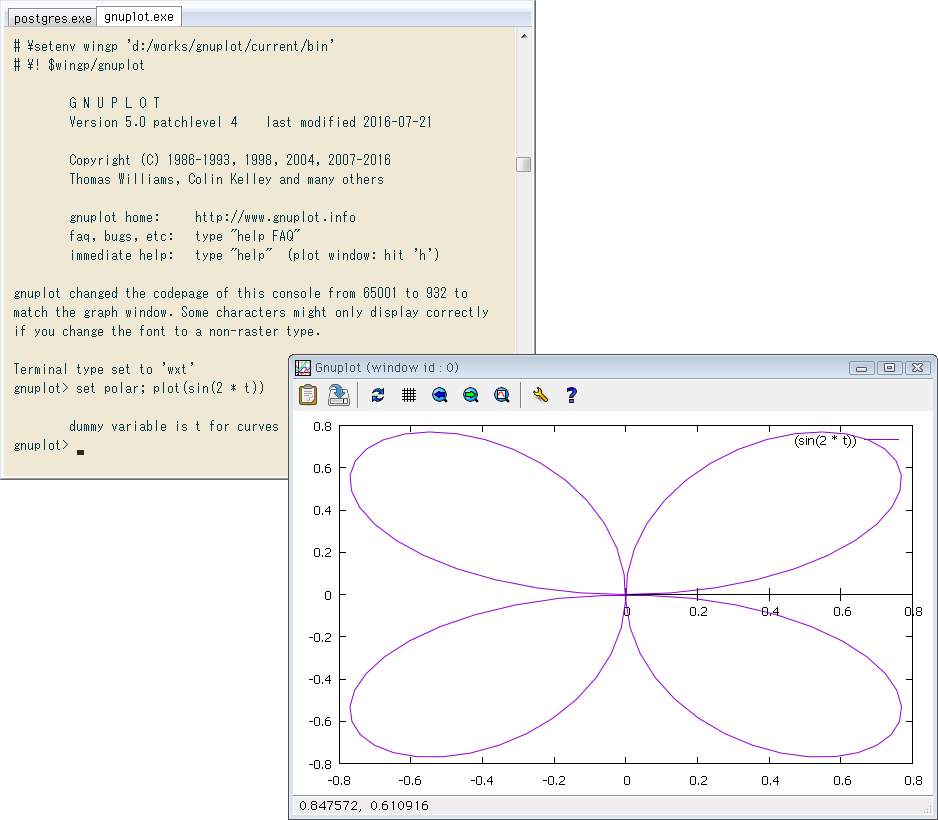
gnuplot> set polar; plot(sin(2 * t))
(graphic window appears)
gnuplot> exit
#
psqlから標準出力でgnuplotにデータを渡す
前回のバッチモードとほぼ同じ構文。psqlのメタコマンド\gからパイプでクエリ結果をgnuplotに送り、そのままプロットします。
前回と違うポイントは、gnuplotの起動オプション-p(--persist)の追加。コマンド実行が終わってもグラフィックウィンドウを開いたままにするもので、これがないとグラフが一瞬で閉じ、psqlに戻ってしまいます。
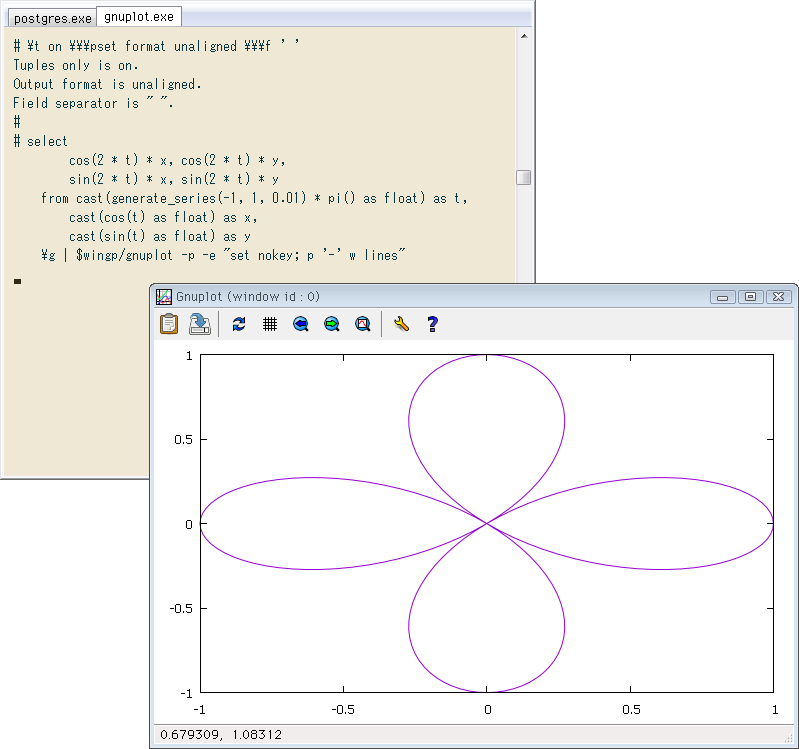
前回はクエリ結果の列間区切りをタブにしましたが、半角空白1つでも良いと分かり ↓ ではそうしました(最初の\fコマンド)。またplotの引数に標準入力を指定する際、前回の '<cat' 以外に '-' だけでも可と分かったので変更。plotもpと略せます。(set nokeyというのは凡例の非表示で、任意)
-- set output format
# \t on \\\pset format unaligned \\\f ' '

-- query and plot the 1st and the 2nd columns
# select
      cos(2 * t) * x, cos(2 * t) * y,
      sin(2 * t) * x, sin(2 * t) * y
  from cast(generate_series(-1, 1, 0.01) * pi() as float) as t,
      cast(cos(t) as float) as x,
      cast(sin(t) as float) as y
  \g | $wingp/gnuplot -p -e "set nokey; p '-' w lines"
グラフを閉じれば自動的にgnuplotが終了し、psqlに戻ります。↓ 今のクエリ結果。グラフになれば何でもよく、ここでは四葉線2つの直交座標(xとy)で、以下ずっとこの結果を使います。式は先ほどのクエリを参照。
# \t off \\\pset format aligned \\\g
+------------------------+------------------------+------------------------+------------------------+
|        ?column?        |        ?column?        |        ?column?        |        ?column?        |
+------------------------+------------------------+------------------------+------------------------+
|                     -1 | -1.22464679914735e-016 | -2.44929359829471e-016 | -2.99951956532372e-032 |
|     -0.997534262484406 |     -0.031348777120193 |    -0.0627595361983212 |   -0.00197229788132577 |
|      -0.99015698957848 |    -0.0622953975282058 |     -0.125085917057519 |   -0.00786973884979149 |
|     -0.977927825140012 |    -0.0924413963603575 |     -0.186549709678872 |    -0.0176341394630685 |
|     -0.960945593601364 |     -0.121395659560187 |     -0.246728893124492 |    -0.0311691077131134 |
|     -0.939347432391753 |     -0.148778017349658 |     -0.305212482389889 |     -0.048340908203385 |
|     -0.913307588115352 |     -0.174222740196636 |     -0.361604054782361 |    -0.0689796626133371 |
|     -0.883035887157219 |     -0.197381906128217 |     -0.415525147524759 |    -0.0928808747815283 |
|     -0.848775894275021 |     -0.217928609381917 |     -0.466618496546772 |      -0.11980726685361 |
|     -0.810802775500298 |     -0.235559981795615 |     -0.514551087834844 |     -0.149490910176645 |
|     -0.769420884293813 |                  -0.25 |     -0.559016994374948 |      -0.18163563200134 |
...
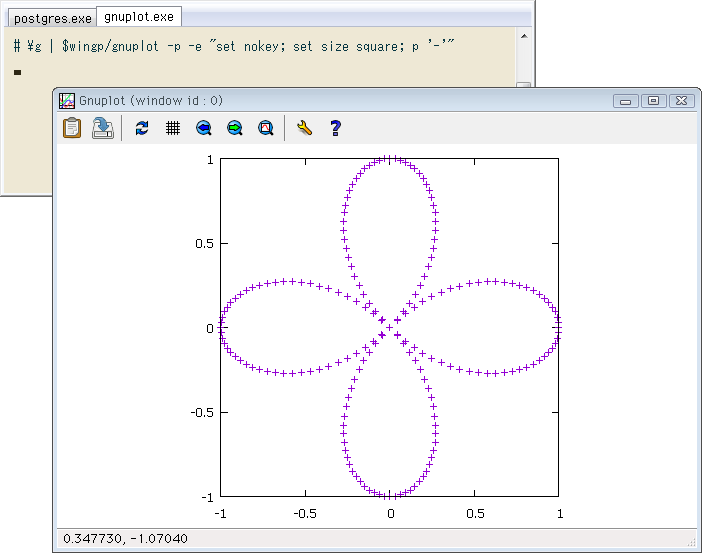
\gコマンドで直前のクエリを再実行できます。それをgnuplotに渡してプロットオプションを少し変えることで、「同じデータ、違うグラフ」の試行錯誤が簡単に可能。↓
# \g | $wingp/gnuplot -p -e "set nokey; set size square; p '-'"
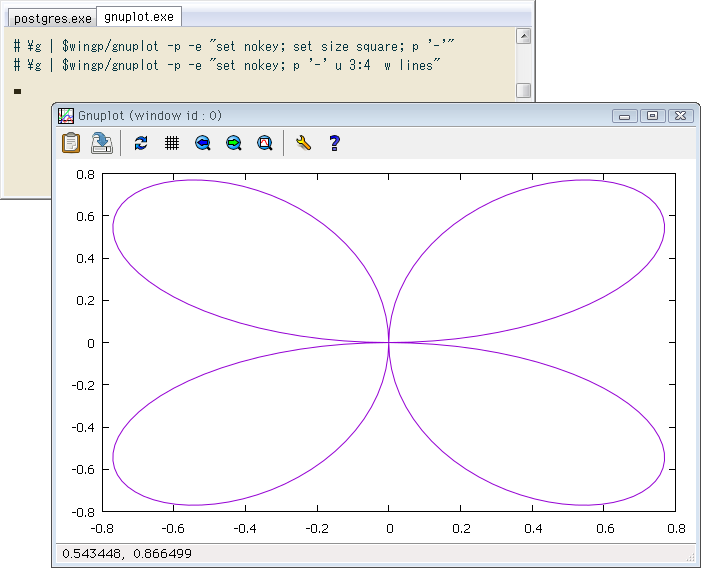
 ↓ クエリ結果のうち第3・4列を使用。オプションusingはuと略せます。
# \g | $wingp/gnuplot -p -e "set nokey; p '-' u 3:4 w lines"
psqlからgnuplotの対話型シェルにデータを渡す
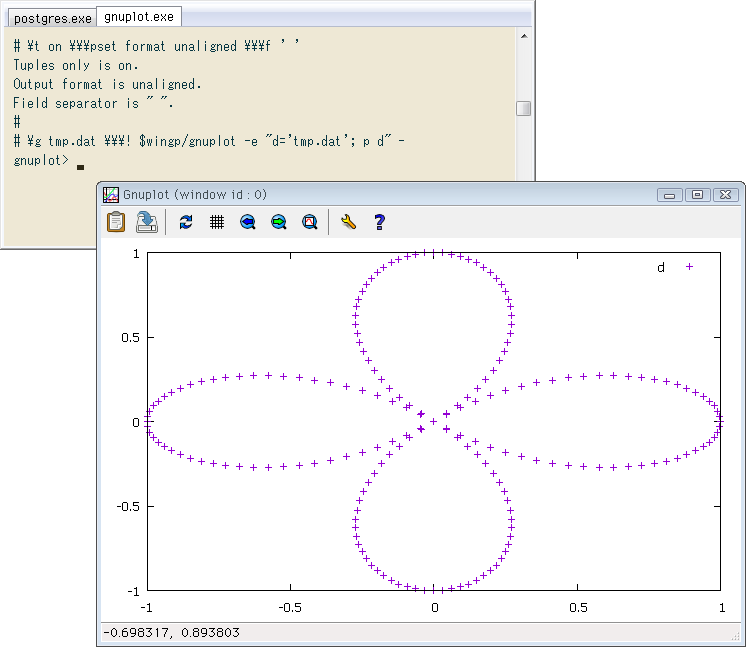
これは前回の対話モードと同じ構文。対話型シェルを起動する際には標準入力でデータを渡せないため、一時ファイルを作ってそのパスを渡します。gnuplotのコマンドライン末尾にハイフンを付けることで対話型シェルに留まり、グラフ表示もそのまま。
# \t on \\\pset format unaligned \\\f ' '
# \g tmp.dat \\\! $wingp/gnuplot -e "d='tmp.dat'; p d" -
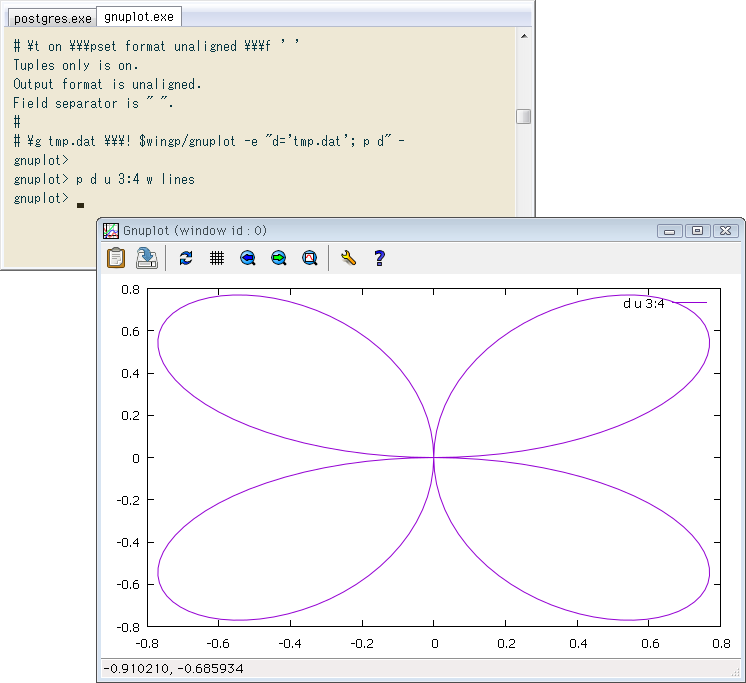
 gnuplotシェルで別のプロットコマンドを打てば ↓ 先ほど出たグラフィックウィンドウ上で更新されます。
gnuplot> p d u 3:4 w lines
gnuplot> ...
 gnuplotを終了すると(exitまたはquit)自動的にグラフ窓が消えpsqlに戻ります。
psqlからGUI版gnuplotを開いてデータを渡し、psqlと並行作業
前項はgnuplotを閉じるまでpsqlに戻らないパターン。こちらはgnuplotとpsqlを並行して使えます。起動プログラムをgnuplotでなくwgnuplotにし、cygstartで起動。他の部分は同じで、一時ファイル経由でpsqlからGUI版gnuplotにデータ(のファイルパス)を渡します。↓
# \g tmp.dat \\\! cygstart $wingp/wgnuplot -e "d='tmp.dat'" -
#
# (returned to psql)

-- on gnuplot
> print(d)
tmp.dat
> p d w filledcu
> ...
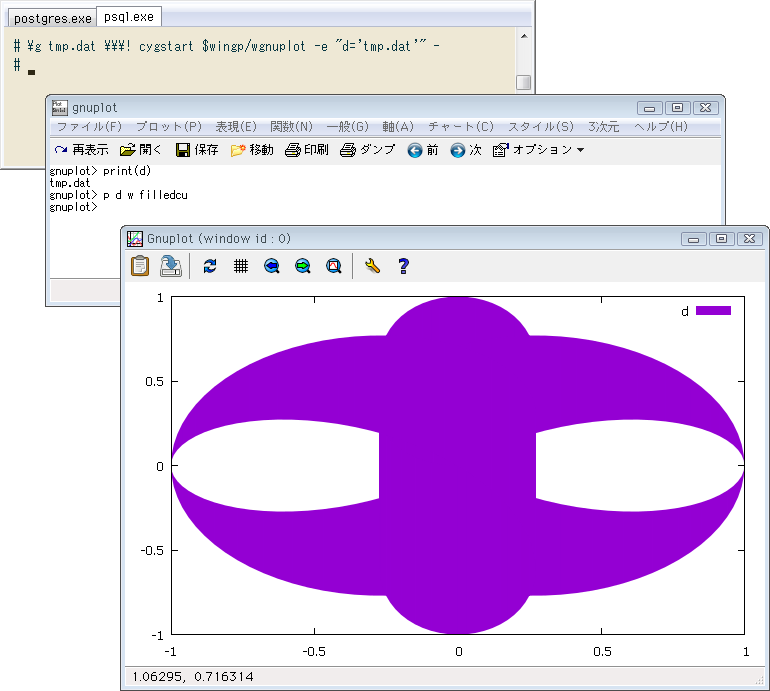 四葉線の塗りがうまくいってませんが、データかプロットオプションの問題。wgnuplotは普通に動作しました。
wgnuplot起動とグラフ描画を同時にするべく、-eで指定するコマンドの中にプロットを含めたらwgnuplot自体が起動しませんでした。あとwgnuplot_pipes.exeという、パイプを受け取れるGUI版にpsqlから標準出力でデータを渡せるか実験したところ ↓ これも無理。何も表示されず、Ctrl-Cでpsqlに戻るしかできません。
四葉線の塗りがうまくいってませんが、データかプロットオプションの問題。wgnuplotは普通に動作しました。
wgnuplot起動とグラフ描画を同時にするべく、-eで指定するコマンドの中にプロットを含めたらwgnuplot自体が起動しませんでした。あとwgnuplot_pipes.exeという、パイプを受け取れるGUI版にpsqlから標準出力でデータを渡せるか実験したところ ↓ これも無理。何も表示されず、Ctrl-Cでpsqlに戻るしかできません。
-- no reaction
# \g | $wingp/wgnuplot_pipes -p -e "p '-'"
(input Ctrl-C and return to psql)
#
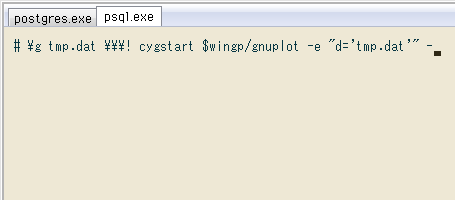
(ConEmuなら)psqlから別タブにgnuplotを開き、psqlと並行作業
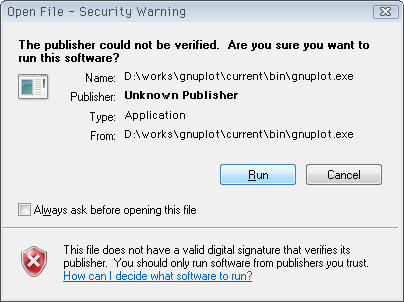
前項のwgnuplotをgnuplotに変えるだけ。普通はコマンドプロンプトがもう一つ起動しそうなところ、ConEmuでは新しいタブが開いてgnuplotシェルになります。cygstartでの初回起動時はセキュリティ警告が出ました(下の画像2つ目)。
# \g tmp.dat \\\! cygstart $wingp/gnuplot -e "d='tmp.dat'" -
#
# (returned to psql)

-- on gnuplot
> print(d)
> set term dumb
> p d
> ...
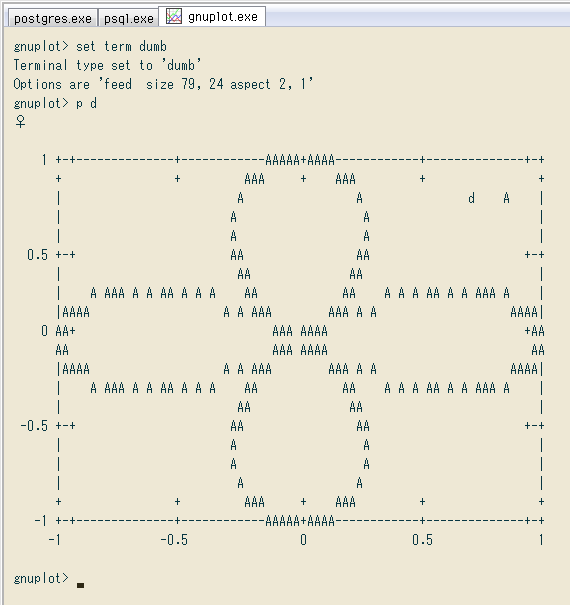 前項と同様、psqlと行ったり来たりして並行作業できます。ただし新規シェル(今回ならgnuplot)とタブの動作はConEmuの設定によって違うと思うので、この通り動かない場合もあるかと。
使いそうな場面別まとめ(前回を含む)
(A)クエリ結果をとにかく簡単に確認(データの値範囲、外れ値の有無など)
… dumbターミナルに標準入力で渡す(前回のここ)
(B)クエリを変えながら、1回ずつ普通のグラフにして見る(見せる)
… Win版gnuplotに標準入力で渡す(今回のここ)
(C)1つのクエリをいろんな形でグラフ化し、その後にpsqlに戻る
… Win版gnuplotの対話型シェルを開く(今回のここ)
(D)グラフ用データをgnuplotに渡し、psqlと並行作業する
… wgnuplotまたはgnuplotをcygstartで開く(今回のここ)または(ここ)
(A)だけCygwin版gnuplot使用ですが、同じことはWin版Gnuplotでも可能(ターミナルをdumbに指定。前項のように)。細かい違いが分かったら追記します。大きな違いがなければ、Cygwin版gnuplotは不要になりそう。