初回に書いたgnuplotに比べると連携のバリエーションは少ないですが、コマンドラインでPostgreSQLのデータを渡してグラフをPDF出力したり、プロットウィンドウに出して止めたりできます。ただし後者はちょっと強引で問題あり。またgnuplotやOctaveと違い「データを渡しつつ対話型シェルに入る」のは無理そうで残念。
実行環境
• Windows7 x64 + Cygwin 2.5.1 + ConEmu 150813g
• Cygwin版psql(パッケージpostgresql-client 9.5.3でインストール)
• Windows版R 3.3.0(R Portable)
• Windowsの管理者権限ユーザ
psqlが接続したPostgreSQLはWindows版の9.5.3(直接関係ないけど。何らかDBサーバに接続しないとpsqlを使えないので)。Rはポータブル版を入れただけの状態で、追加パッケージを入れたり設定ファイル編集はしてません。
準備その1 : CygwinシェルからWindows版Rの起動
CygwinのBashシェルからWindowsネイティブのアプリを起動するのは、gnuplotやOctaveで実行済み。それと同じ形式のフルパス(ドライブレター始まり、スラッシュ区切り)でRも立ち上がりました。
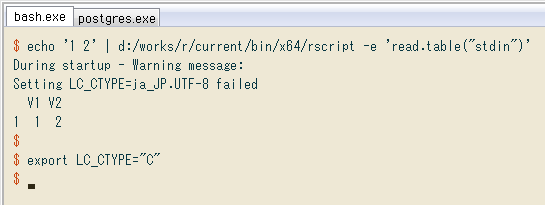
次に、シェルからパイプでRにデータを渡す ↓ テスト。R側で標準入力をデータとして受け取った確認を、-eに続くコマンドで行ってます。ロケール関係の警告が出たので(CygwinはUTF-8、Windowsはそれが不可)LC_CTYPEをCに設定。
$ echo '1 2' | d:/works/r/current/bin/x64/rscript -e 'read.table("stdin")'
During startup - Warning message:
Setting LC_CTYPE=ja_JP.UTF-8 failed
  V1 V2
1  1  2

# suppress the warning about locale
export LC_CTYPE="C"
 関連で、パイプから-eオプションでなくスクリプトを実行する例は下記にあります。
標準入力で受けたデータをRで加工して標準出力へ渡す - Qiita
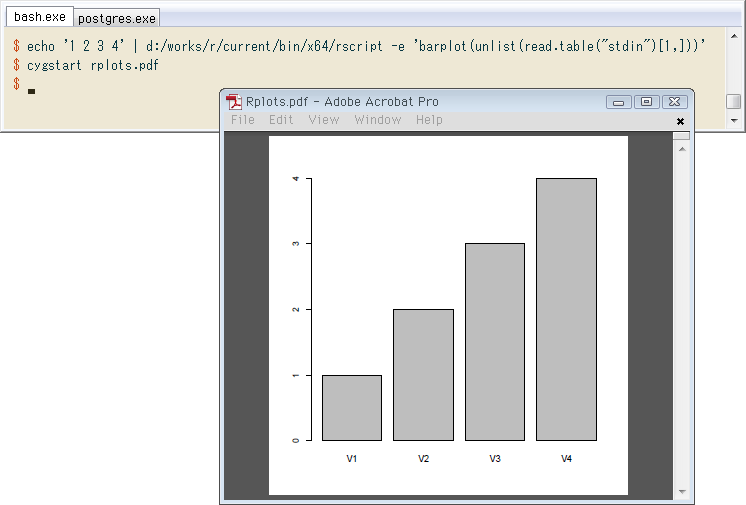
Octaveではできなかった「stdinでパイプからデータを受け取る」が、Rではこのように簡単。さらにコマンドラインでグラフ出力して開く ↓ 例です。対話シェル以外はデフォルトの出力デバイスがPDFで、ワーキングディレクトリ下のRplots.pdfに。それをcygstartで実行してます(デフォルトのアプリが開く)。
関連で、パイプから-eオプションでなくスクリプトを実行する例は下記にあります。
標準入力で受けたデータをRで加工して標準出力へ渡す - Qiita
Octaveではできなかった「stdinでパイプからデータを受け取る」が、Rではこのように簡単。さらにコマンドラインでグラフ出力して開く ↓ 例です。対話シェル以外はデフォルトの出力デバイスがPDFで、ワーキングディレクトリ下のRplots.pdfに。それをcygstartで実行してます(デフォルトのアプリが開く)。
$ echo '1 2 3 4' | d:/works/r/current/bin/x64/rscript -e 'barplot(unlist(read.table("stdin")[1,]))'

# open PDF
$ cygstart rplots.pdf
準備その2 : CygwinシェルからRのプロットウィンドウにグラフ描画
コマンドラインから、PDF保存でなくプロットウィンドウでもグラフを見たい。プロット前にx11()を実行すると出力デバイスがウィンドウになるけど、Rのコマンド終了とともに閉じてしまいます。Octaveでのwaitforみたいに止める方法を探した結果 ↓ で一応止まりました。
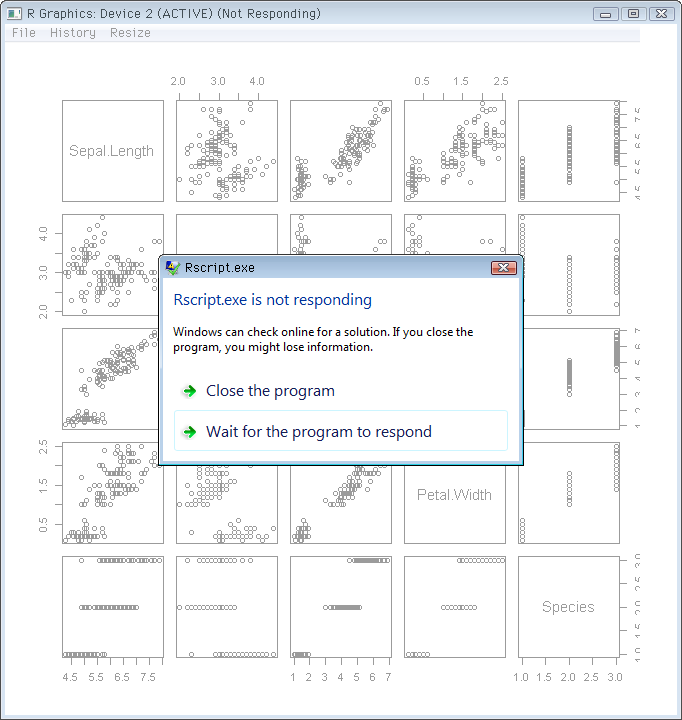
$ d:/works/r/current/bin/x64/rscript -e 'x11(); plot(iris); scan("stdin")'
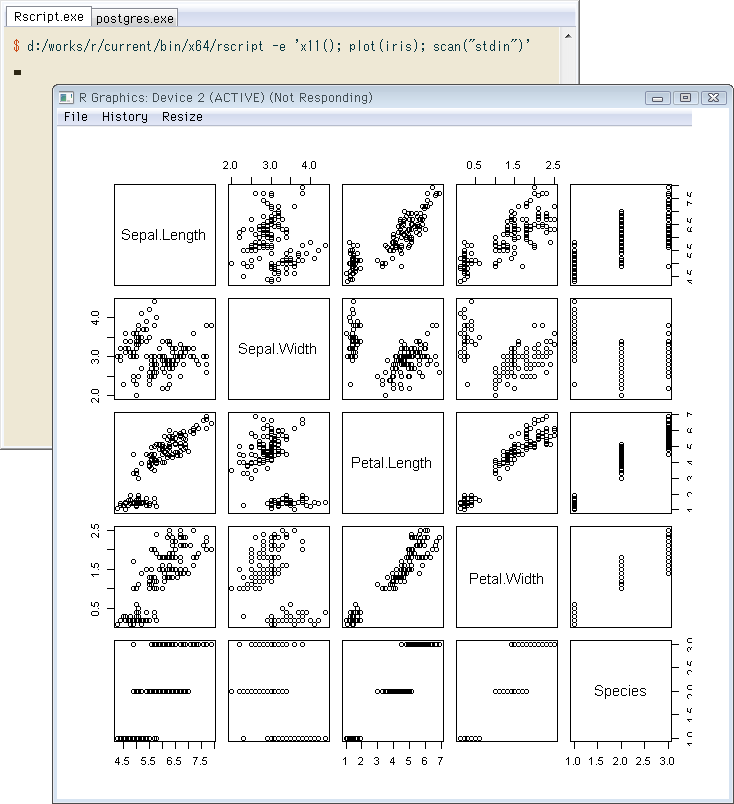 ただし難あり。Rそのものが「応答なし」状態になってしまい、グラフに触れると ↓ こんな風に強制終了するかのダイアログが出て、まともに見れません。本当に「パッと出力して見る」だけ。Rの強制終了は、シェルでのCtrl-C打鍵でも可です。
 この方法だと、前項のようにパイプでデータを渡しても上手くいかず ↓ 一瞬でRが終了します。パイプで標準入力を受け取りながら、動作を止めるのにもscan("stdin")してるので確かに無理っぽい。プロットウィンドウにグラフを出したければ、データはパイプでなくファイルで渡すしかないです。
$ echo '1 2' | d:/works/r/current/bin/x64/rscript -e 'x11(); plot(read.table("stdin")); scan("stdin")'
Read 0 items
numeric(0)
scan("stdin")以外に、ウェブ情報を参考に試したけど止まらなかったものは下記のとおり。主なサイトも付記します。
devAskNew()
dev.hold()
getGraphicsEvent()
Sys.sleep(Inf)
Stack Overflow - How to pause for each plot when running R function
Stack Overflow - How to wait for a keypress in R?
確認 … データを渡しつつ対話型シェルに入るのは、Rでは厳しい
gnuplot、Octaveで簡単に出来た「とりあえずデータを渡してざっくりグラフ化、そのまま対話型シェルに入って微調整」という、最も使いそうなパターンがRで出来ないか試しましたが、事実上厳しい…。絶対に無理ではないけど(初期実行ファイル.Rprofileを使って)、1コマンドごとに行うのは非現実的な気がしました。
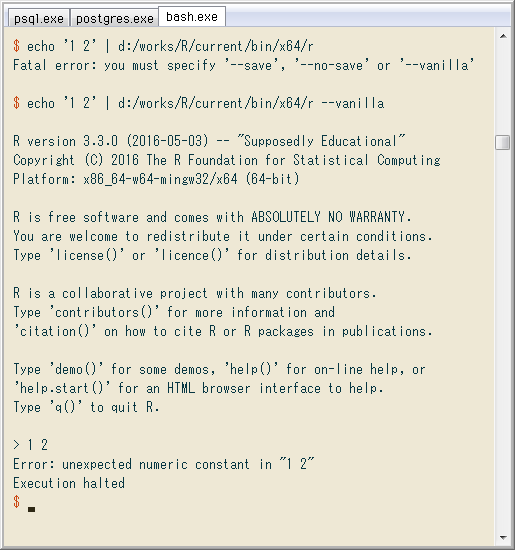
以下、参考までに出来ない場面の例をいくつか。単純にパイプを、RscriptでなくRコマンドに渡すと ↓ 起動オプションで3つのどれかを指定するように言われます。
$ echo '1 2' | d:/works/R/current/bin/x64/r
Fatal error: you must specify '--save', '--no-save' or '--vanilla'
で、例えば--vanillaオプションだと ↓ パイプから標準入力は受け取るものの、それ全体をコマンドとして実行しようとして終了。普通のデータはRのコマンドに解釈できないため、エラーになります。
$ echo '1 2' | d:/works/R/current/bin/x64/r --vanilla

R version 3.3.0 (2016-05-03) -- "Supposedly Educational"
Copyright (C) 2016 The R Foundation for Statistical Computing
Platform: x86_64-w64-mingw32/x64 (64-bit)
...
Type 'demo()' for some demos, 'help()' for on-line help, or
'help.start()' for an HTML browser interface to help.
Type 'q()' to quit R.

> 1 2
Error: unexpected numeric constant in "1 2"
Execution halted
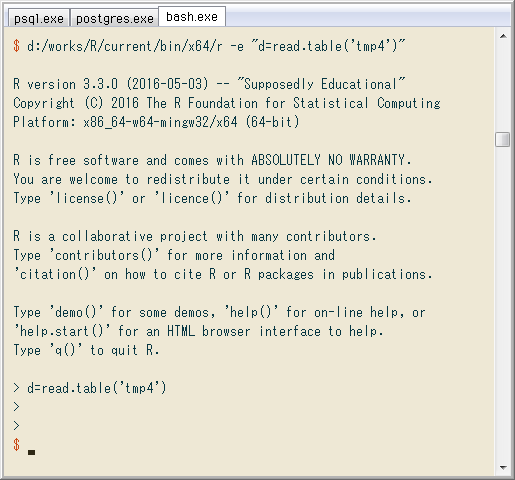
 パイプでなく-eで、コマンド実行後に対話型シェルに留まれないか試しても ↓ やっぱり駄目でした。
$ d:/works/R/current/bin/x64/r -e "d=read.table('tmp4')"

R version 3.3.0 (2016-05-03) -- "Supposedly Educational"
Copyright (C) 2016 The R Foundation for Statistical Computing
Platform: x86_64-w64-mingw32/x64 (64-bit)
...
Type 'demo()' for some demos, 'help()' for on-line help, or
'help.start()' for an HTML browser interface to help.
Type 'q()' to quit R.

> d=read.table('tmp4')
>
$
 Rの対話型シェル(インタラクティブモード)と非対話型(スクリプト実行モード)については、マニュアルのinteractive関数の頁に起動時オプションがいくつかあったので当初できるかな~と思いましたが、結局だめ。要するにoctaveの--persistに当たるものは無いようです。
psqlからRにデータを渡し、グラフ出力
psqlの前のCygwinシェルでの準備・確認が長びきました。やっとpsqlから、まずパイプでRにデータを渡す確認。↓ は、最初にRの起動コマンドをシェルの環境変数に、続いてpsqlでの表示形式設定。そしてクエリを書き、セミコロンの代わりに\g以下のメタコマンドを打ってRに渡し、先頭だけ表示させたところ。
-- set command to psql variable
# \setenv r 'd:/works/r/current/bin/x64/rscript -e'

-- set output format
# \f ' ' \\\t on \\\pset format unaligned

-- query and pipe to R
# select x, y, sin(r) / r
  from generate_series(-8, 8, 0.4) as x,
      generate_series(-8, 8, 0.4) as y,
      cast(sqrt(x^2 + y^2) + 1e-9 as float) as r
  \g | $r 'head(read.table("stdin"))'
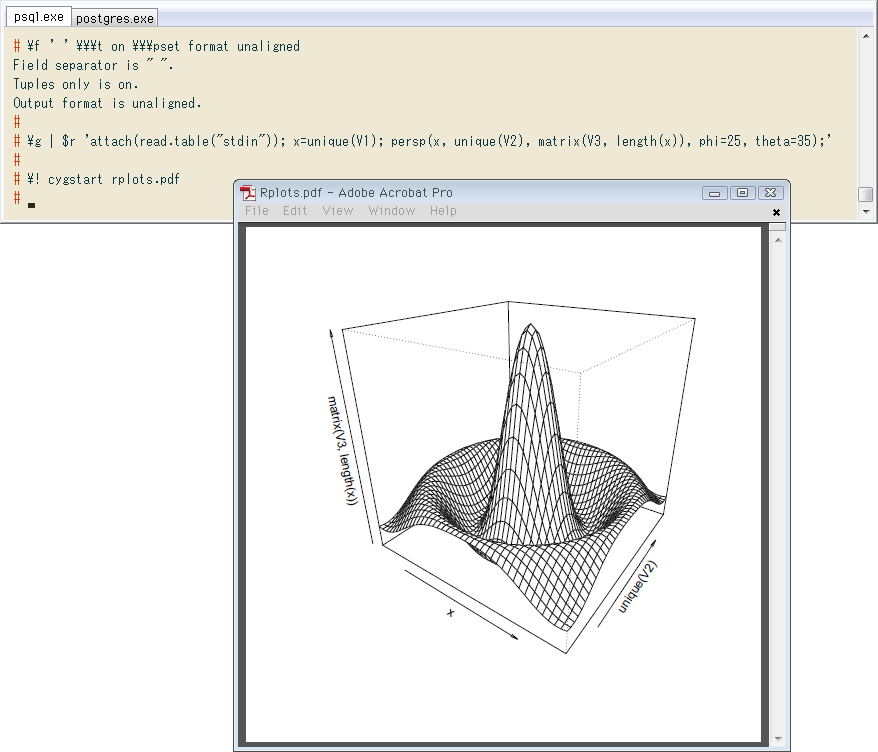
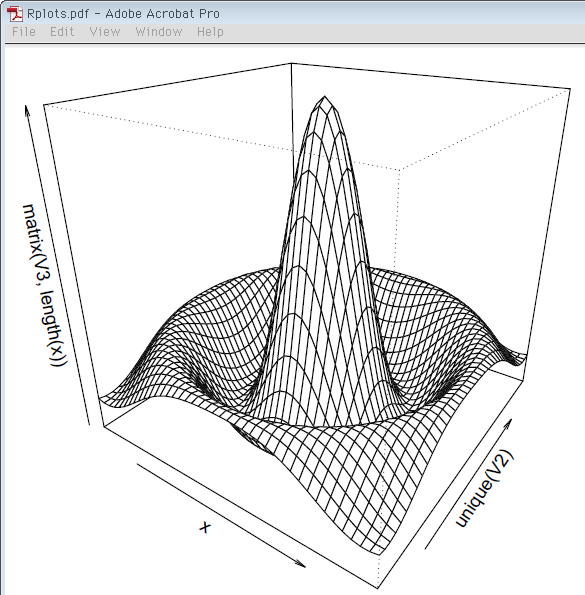
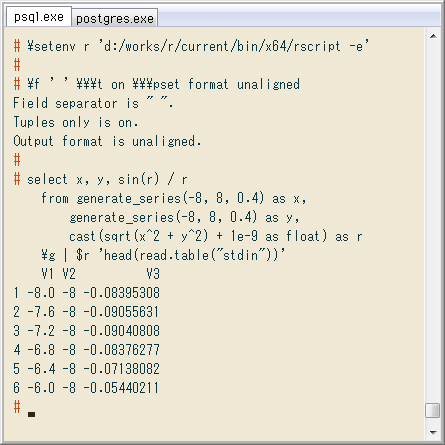 上でクエリしたのは、前回のOctaveと同じソンブレロの3次元座標。以下も同じクエリを使い、ずっと\gコマンドで呼び出します。データをRのpersp関数でプロットし、保存されたPDFを開いたようす。↓
-- set output format
# \f ' ' \\\t on \\\pset format unaligned

-- query again and pipe to R
# \g | $r 'attach(read.table("stdin")); x=unique(V1); persp(x, unique(V2), matrix(V3, length(x)), phi=25, theta=35);'

-- open PDF
# \! cygstart rplots.pdf
Rのプロットは、デフォルトの余白が広めです。拡大すると ↓ こんな感じ。PDF本体も置いておきます(28kB)。
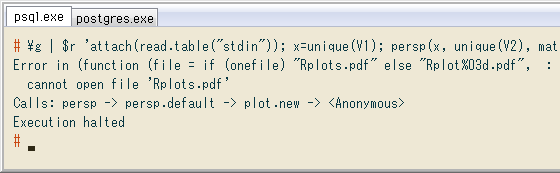
 注意点。PDFを、Acrobatなどファイルをロックするアプリで開いたまま、同じファイル名でRから出力しようとすると ↓ エラーになります。このへんがグラフをファイル出力した時の面倒な点。いろんなグラフを次々に作っていく場合は特に。だからプロットウィンドウに出したい…。
# \g | $r '...'
Error in (function (file = if (onefile) "Rplots.pdf" else "Rplot%03d.pdf",  :
  cannot open file 'Rplots.pdf'
Calls: persp -> persp.default -> plot.new ->
Execution halted
psqlからRのプロットウィンドウにグラフを出す(限定的)
前項のようにファイル出力では面倒な時、使える範囲は限られて問題もありますが一応、psqlからRにデータを渡してプロットウィンドウでグラフ化する例。↓ パイプでなく一時ファイルを経由し、外部コマンドとしてRを起動し-eオプションの引数としてコードを実行します。scan("stdin")でRが止まり、グラフが出たまま。
-- set command to psql variable
# \setenv r 'd:/works/r/current/bin/x64/rscript -e'

-- set output format
# \f ' ' \\\t on \\\pset format unaligned

# \g tmp4
  \! $r "d=read.table('tmp4'); x11(); plot(d); scan('stdin')"
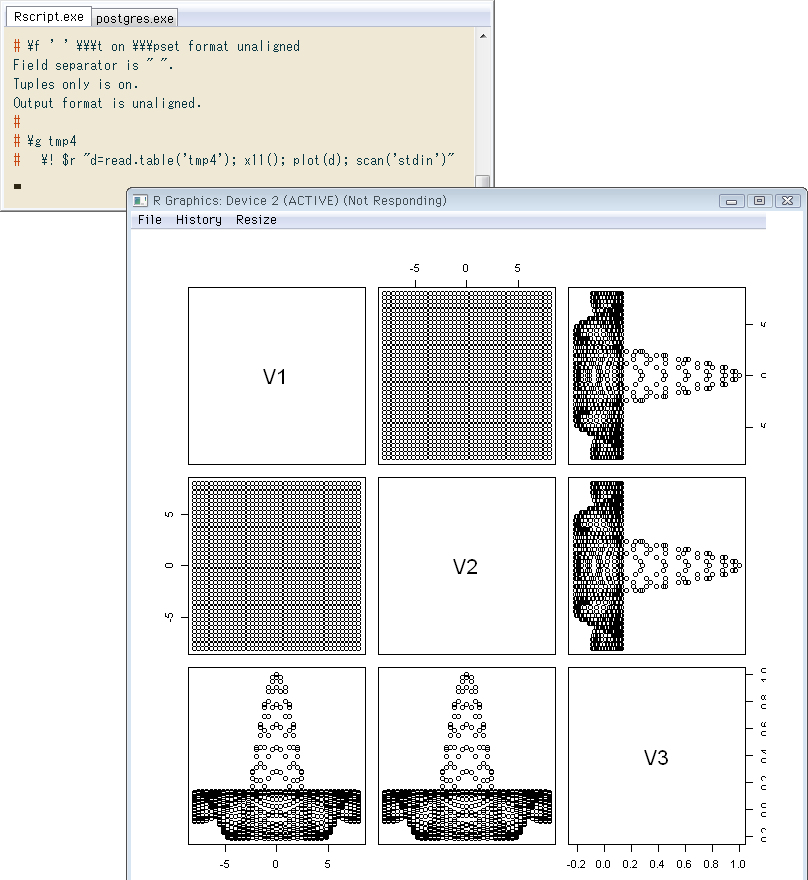 ただしCygwinシェルで試した時と同様、Rが正常に止まるのでなく「応答しなくなる」ゆえの問題あり。psqlに戻るにはシェルでCtrl-Cを打ちます。
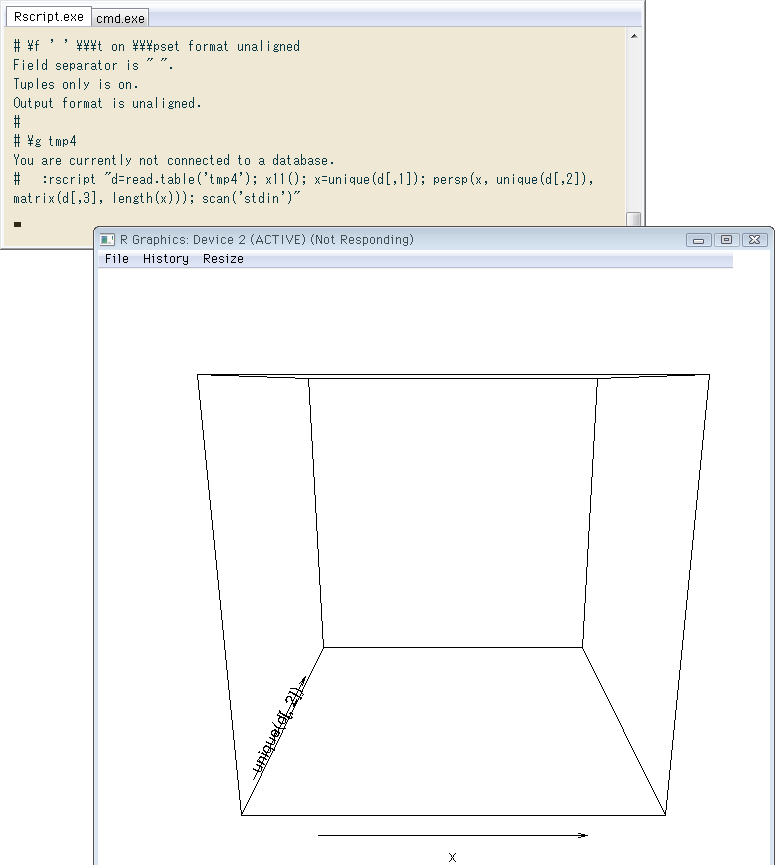
また、上の2次元プロットはグラフ描画された一方、perspは変。エラーは起きないのに ↓ 全く表示されない場合もあれば…
ただしCygwinシェルで試した時と同様、Rが正常に止まるのでなく「応答しなくなる」ゆえの問題あり。psqlに戻るにはシェルでCtrl-Cを打ちます。
また、上の2次元プロットはグラフ描画された一方、perspは変。エラーは起きないのに ↓ 全く表示されない場合もあれば…
-- set output format
# \f ' ' \\\t on \\\pset format unaligned

# \g tmp4
  \! $r "d=read.table('tmp4'); x11(); x=unique(d[,1]); persp(x, unique(d[,2]), matrix(d[,3], length(x)), phi=25, theta=35); scan('stdin')"
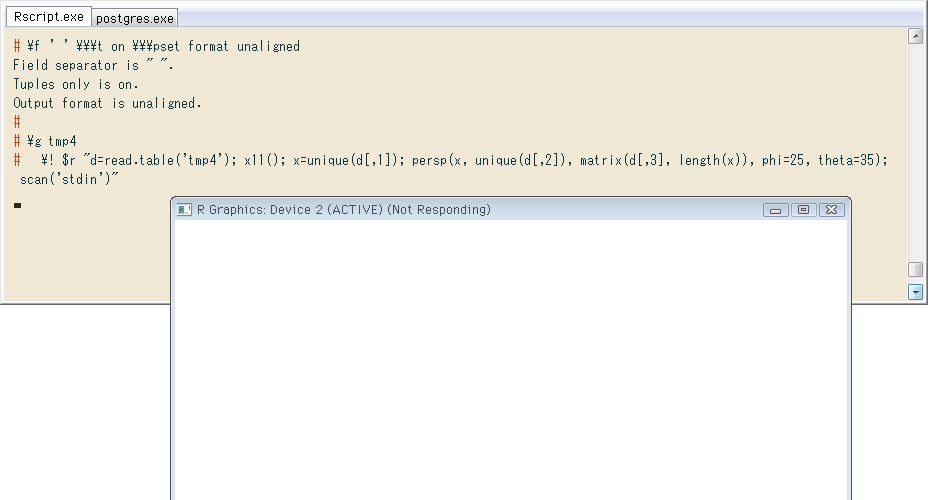 ↓ なぜか3次元座標だけ描画され、中身は空という場合も。
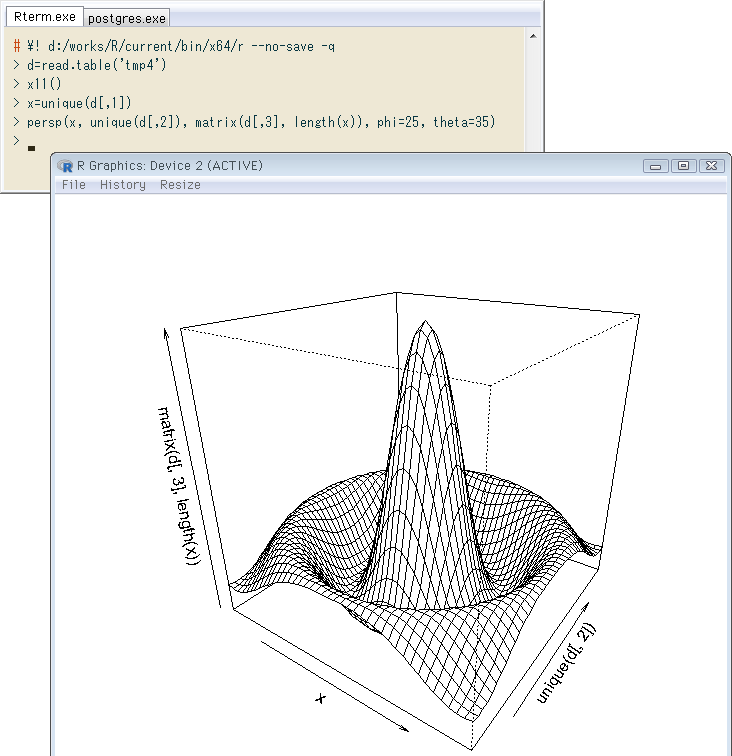
 ↓ 同様のコードをインタラクティブシェルで実行すると、普通。Rのプロットウィンドウは結構謎があります。前も、何かの条件の時だけラスタが消えたし。
# \! d:/works/R/current/bin/x64/r --no-save -q
> d=read.table('tmp4')
> x11()
> x=unique(d[,1])
> persp(x, unique(d[,2]), matrix(d[,3], length(x)), phi=25, theta=35)
 そもそもPL/RストアドからPDFにグラフ出力できるし、RからPostgreSQLに接続するパッケージ(RPostgreSQL)もあります。グラフをいろいろ調整したりデータ操作をR側で行うなら、PL/RストアドかRスクリプトの方が現実的。
それと対照的にPostgreSQLのデータをサクッとグラフ化する趣旨でしたが、(1)PDF出力がデフォルトなのでいちいち開いたり閉じたり手間、(2)プロットウィンドウに出す方法は無理矢理で不安定、(3)グラフを作りつつ対話シェルに入れない、と限界もいくつか。より良い実行方法や使い道が分かったら追記します。
そもそもPL/RストアドからPDFにグラフ出力できるし、RからPostgreSQLに接続するパッケージ(RPostgreSQL)もあります。グラフをいろいろ調整したりデータ操作をR側で行うなら、PL/RストアドかRスクリプトの方が現実的。
それと対照的にPostgreSQLのデータをサクッとグラフ化する趣旨でしたが、(1)PDF出力がデフォルトなのでいちいち開いたり閉じたり手間、(2)プロットウィンドウに出す方法は無理矢理で不安定、(3)グラフを作りつつ対話シェルに入れない、と限界もいくつか。より良い実行方法や使い道が分かったら追記します。